FUTURE #SMARTMobility needs Sustainable #CLEANEnergy
Efficiency and CO2 emission analysis of Internal Combustion Engines (ICE) and Electric Vehicles (EV)
This blog is an addition to a study commissioned by the Austrian Ministry for Transport, Innovation and Technology and the Federation of the Austrian economy [1]. We want to stress the significance of transparent information regarding the vehicles efficiency and the environmental footprint.
In Austria, an Electric Vehicle (EV) needs to drive 80.000km to have lower CO2 emissions as an Internal Combustion Engine (ICE) due to the electricity mix of the country. In countries with an electricity production depending heavily on coal like Poland and China, the EVs will always have higher CO2 emissions than an ICE. To provide you a better overview a summary of the essential drivetrain efficiency and CO2 emissions is provided.
Analysing various fuel productions and drivetrains:
For an objective analysis of the overall efficiency of a drivetrain, the entire energy chain must be examined. At the moment this is called well-to-wheel analysis, which investigates the used energy and the efficiency from the energy source to the wheel. The overall efficiency is strongly influenced by energy production. The well-to-tank analysis provides information on the efficiency of energy generation (how much energy is lost during e. g. electric power generation). The tank-to-wheel analyses refer to the used energy in vehicles from the tank system to the road.
Figure 1.1 explains the well-to-wheel analysis with the subcategories well-to-tank and tank-to-wheel.
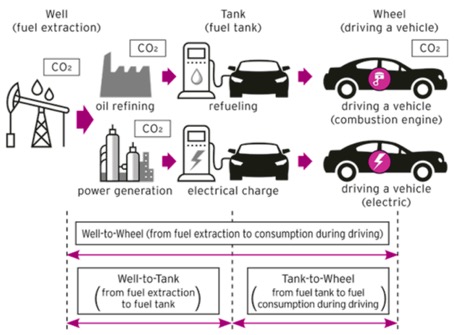
Figure 1.1: Conceptual illustration of Well-to-Wheel analyses for efficiency and CO2 emissions (Source: Own illustration based on [2])
Well-to-tank analysis:
Figure 1.2 gives an overview of the efficiency in energy production of fuels. Minimum or fixed values are displayed in violet. Values that are dependent on the efficiency of the used production method are striped violet. Values for the EU electricity mix are marked in blue and the values for the Austrian electricity mix are marked in red.
With little effort raw natural gas is produced by drying and desulphurisation at efficiencies around 90%. The production and supply of fossil fuels, such as petrol and diesel, are also produced at high efficiencies of up to 85%. Production efficiency of bio-fuels gaseous is strongly dependent on the raw material and the processing method, typical efficiencies between 15 and 50%. Hydrogen can be produced at efficiencies of between 10 and 80%, both in the production from methane and in the production with electrolysis, values of up to 80% can be achieved. The generation of electricity takes place between 15 and 90% efficiency.
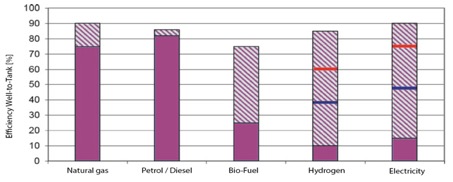
Figure 1.2: Well-to-Tank analysis of the efficiency (Source: Own illustration based on [3])
Figure 1.3 shows the CO2 emissions of the well-to-tank analysis. The production of fossil fuels cause emissions of approximately 50 g CO2/kWh for petrol and diesel. Biogenic fuels are often described as CO2-neutral, because of the collected CO2 due to photosynthesis during the growth process of the plants. However, depending on the raw material used and the manufacturing process, a broad spectrum of greenhouse gas emissions is produced. Some production methods produce higher CO2 emissions than fossil fuels and some produce fewer greenhouse gases than the plant collects through photosynthesis. For electricity, the values lie between 15 g CO2/kWh when generated from wind energy and over 1000 g CO2/kWh from lignite production. With the EU electricity mix 340 g CO2/kWh are produced. If hydrogen is produced by electrolysis, the emission loads can vary from 21 g CO2/kWh to 1400 g CO2/kWh. The value for the European electricity mix is approximately 425 g CO2/kWh and for the Austrian electricity mix 129 g CO2/kWh.
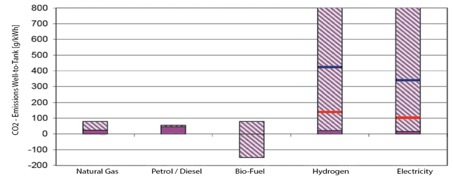
Figure 1.3: Well-to-Tank analysis of CO2 emissions (Source: Own illustration based on [3])
Tank-to-Wheel efficiencies and CO2 emissions
Despite these developments, the combustion engine is not very efficient compared to alternative propulsion technologies. Tank-to-wheel analyses refer to the used energy in vehicles from the tank system to the road. The petrol engine can achieve an efficiency of up to 35% at the best point, and an average of 20% in a driving mode according to the NEDC driving cycle. The diesel engine reaches approx. 45% at its best point and approx. 28% in a driving mode according to the NEDC driving cycle.
The battery-powered electric vehicle can achieve an efficiency of more than 85% at the best point, in driving mode (NEDC driving cycle) an average of 60 – 75% is achieved. The fuel cell vehicle can achieve an efficiency of more than 65% at its best point, in transient driving mode (NEDC driving cycle) an average of 40-55% is achieved.
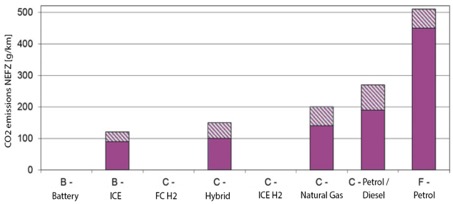
Figure 1.4: Tank-to-Wheel analysis of CO2 emissions of different vehicle segments and drivetrains (Source: Own illustration based on [3])
The emissions in g CO2 per km tested on the NEFZ cycle for different vehicle segments (B/small cars, C/medium cars, F/luxury cars) and drive trains is shown in Figure 1.4. Vehicles with battery-powered electric motors or hydrogen-powered FCEV as well as hydrogen-powered combustion engines are CO2-free in operation.
Well-to-Wheel efficiencies and CO2 emissions
For an objective analysis of the overall efficiency of a drivetrain concept, the entire energy chain must be examined. This is called well-to-wheel analysis, which investigates the used energy and the efficiency from the energy source to the wheel. The overall efficiency is strongly influenced by energy production. For petrol engines, the Well-to-Wheel efficiency drops and reaches between 14% and 20%. The diesel engine still achieves 21% to 26% overall efficiency.
With BEVs, the well-to-wheel efficiency drops to approx. 32% with the EU electricity mix. With the Austrian electricity mix, an overall efficiency of approx. 50% is possible. With FCEV, the well-to-wheel efficiency drops to approx. 22% due to the high energy consumption with the EU electricity mix. With the Austrian electricity mix, an overall efficiency of approx. 34% is possible. This corresponds to a higher degree of efficiency than with combustion engines.
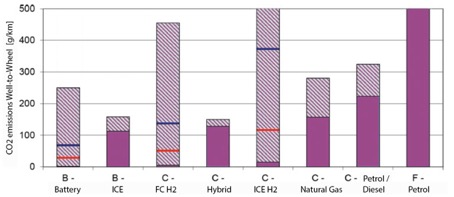
Figure 1.5: Well-to-Wheel analysis of CO2 emissions of different vehicle segments and drivetrains (Source: Own illustration based on [3])
For the determination of the total CO2 emissions, the values of the well-to-tank and tank-to-wheel are summed up for the well-to-wheel analysis, shown in Figure 1.5. The range of the BEV reaches from a CO2 free operation with energy from renewable energy sources to electricity produced with lignite. For FCEV and internal combustion engines the range is between electrolysis from renewable electricity to lignite produced electricity. The Austrian Energy mix is shown with red bars and the EU energy mix is marked with the blue bars.
Conclusion:
With the Well-to-Wheel analysis it is possible to assess the efficiency of drivetrains and the energy transport/production. The analysis above was made with the NEDC test cycle. It is to be expected that with the new WLTP test cycle the CO2 emissions will increase about 20%. Another disadvantage is: the analysis gives no information about the raw material production (steel, aluminium, …), the production of the vehicle itself, the recycling and the disposal of the vehicle. An analysis considering the use phase, the energy supply and the product life cycle is called Cradle-to-Grave analysis. Only with the Cradle-to-Grave analysis the vehicles can be compared objectively and as a whole. The other methods will lead to insecure customers and false information.
What can be seen very clearly with the Well-to-Wheel analysis is that the electrification of the drivetrain requires an energy revolution towards sustainable energy production.
Authors: Dr. Hans-Peter Kleebinder, Michael Semmer
References
[1] H.-P. Dr. Kleebinder, A. Dr. Kleissner, and M. Semmer, “Auf der Siegerstraße bleiben! Automotive Cluster der Zukunft bauen.,” Wien, Nov. 2019.
[2] Mazda, MAZDA: Aiming to Make Cars that are Sustainable with the Earth and Society. [Online] Available: https://www.mazda.com/en/csr/special/2016_01/. Accessed on: Nov. 06 2019.
[3] M. Klell, H. Eichlseder, and A. Trattner, Wasserstoff in der Fahrzeugtechnik: Erzeugung, Speicherung, Anwendung, 4th ed. Wiesbaden: Springer Vieweg, 2018.
Thumbnail by Petovarga – stock.adobe.com


